
Purchase, New York – 26 September 2017 –
Around the world, tourism is driving the economic engines of growth and development. Since 2009, international travel and spending by overnight visitors to cities have grown faster than real GDP. To help cities understand key drivers and unlock the value of tourism, Mastercard today released its annual Mastercard Destination Cities Index.
The Index is more than just a ranking of the 132 top destination cities of today and tomorrow. Based on visitor volume and spend for the 2016 calendar year, the in-depth analysis also provides a forecast for growth in 2017, insight on the fastest growing destination cities, and a deeper understanding of why people travel and how they spend around the world.
The Global Top 10 Destination Cities
International overnight visitors to the Top 10 destination cities were up in 2016 overall. Forecasts for continued growth in 2017, with Tokyo expecting the largest growth in visitors among the Top 10.
|
2016 International Overnight Visitors |
Growth Forecast for 2017 |
|
|
Bangkok |
19.41 million visitors |
4.0 percent |
|
London |
19.06 million visitors |
5.0 percent |
|
Paris |
15.45 million visitors |
4.4 percent |
|
Dubai |
14.87 million visitors |
7.7 percent |
|
Singapore |
13.11 million visitors |
2.6 percent |
|
New York |
12.70 million visitors |
(-2.4 percent) |
|
Seoul |
12.39 million visitors |
0.4 percent |
|
Kuala Lumpur |
11.28 million visitors |
7.2 percent |
|
Tokyo |
11.15 million visitors |
12.2 percent |
|
Istanbul |
9.16 million visitors |
0.9 percent |
Spending Power: Destination Cities as Engines of Economic Growth
Since 2009, more than half of the top destination cities reported an increase in spend by overnight visitors consistent with or greater than GDP growth. These cities benefit greatly from tourism and are primed to be engines of broad economic growth for countries.
|
2016 International Overnight Visitor Spend |
Growth Forecast for 2017 |
|
|
Dubai |
$28.50 billion USD |
10.2 percent |
|
New York |
$17.02 billion USD |
1.5 percent |
|
London |
$16.09 billion USD |
(-4.6 percent) |
|
Singapore |
$15.69 billion USD |
0.3 percent |
|
Bangkok |
$14.08 billion USD |
10.9 percent |
|
Paris |
$12.03 billion USD |
4.9 percent |
|
Tokyo |
$11.28 billion USD |
3.7 percent |
|
Taipei |
$9.91 billion USD |
6.9 percent |
|
Seoul |
$9.38 billion USD |
1.8 percent |
|
Barcelona |
$8.90 billion USD |
6.9 percent |
Destination Cities of Tomorrow
Globally, international overnight visitor arrivals across all 132 destinations have grown by 55.2 percent since 2009, significantly outpacing real GDP growth during the same period. The fastest growing destinations continue to demonstrate the importance of watching Asia/Pacific and the Middle East for future destination leaders.
|
Growth in visitors from 2009-2016 |
|
|
Osaka |
24.0 percent |
|
Chengdu |
22.7 percent |
|
Colombo |
20.3 percent |
|
Abu Dhabi |
18.9 percent |
|
Jakarta |
18.2 percent |
|
Tokyo |
17.7 percent |
|
Hanoi |
16.4 percent |
|
Riyadh |
15.9 percent |
|
Lima |
15.2 percent |
|
Taipei |
14.5 percent |
Insights into Purpose of Travel and Local Spend
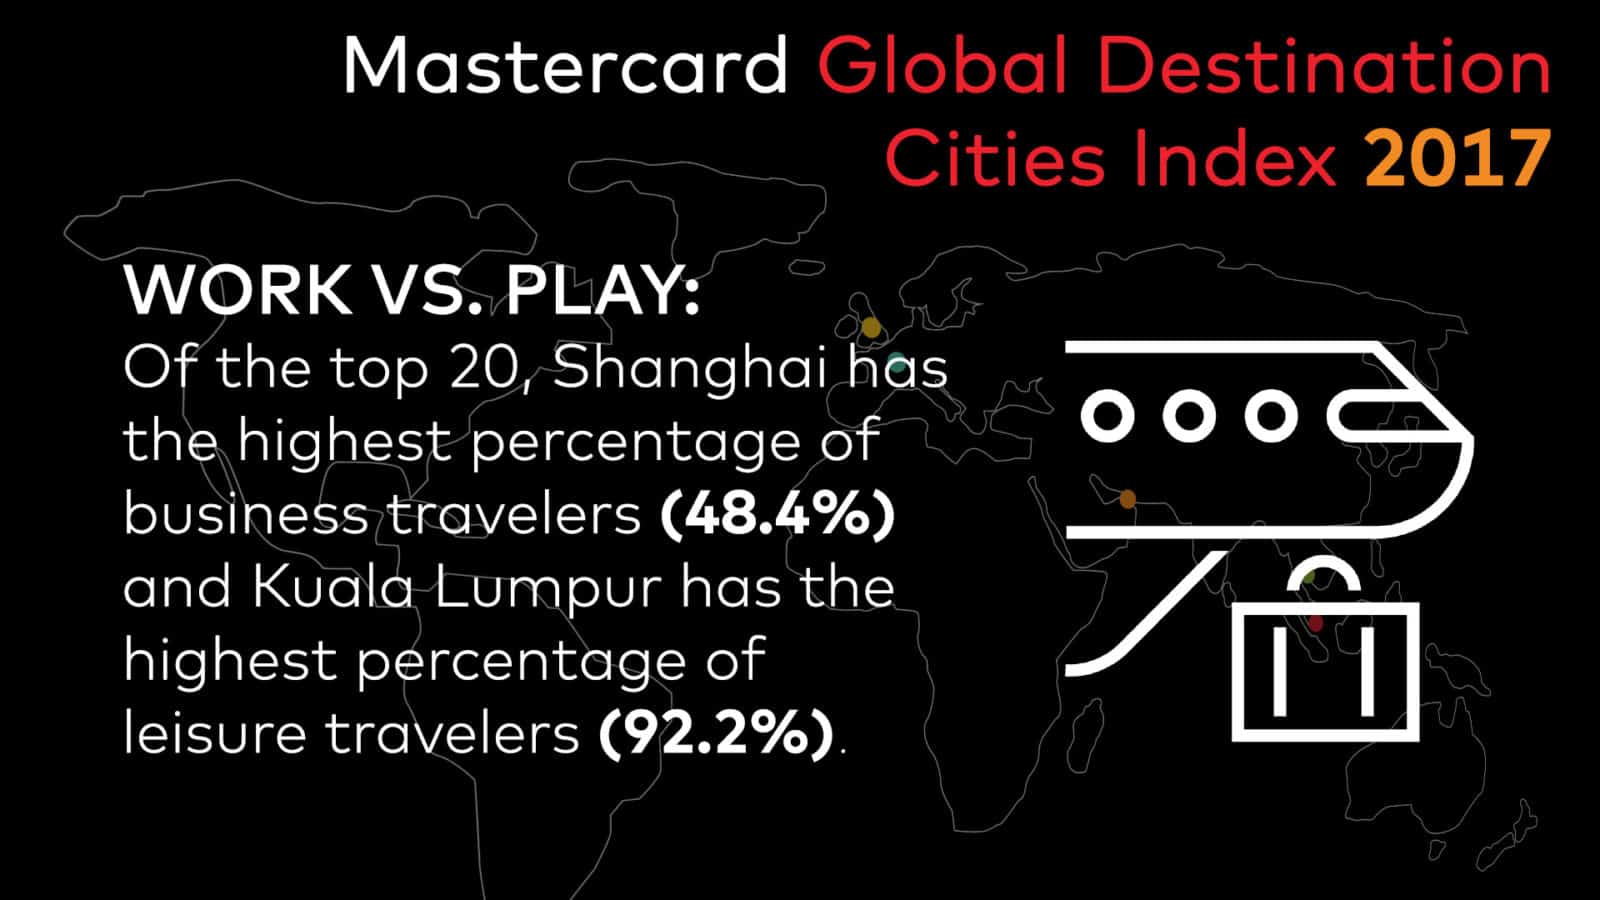
Across the Top 20 destination cities, the majority of travel is conducted for leisure purposes, except in Shanghai where nearly half (48.4 percent) of visitors are travelling on business. Conversely, Kuala Lumpur has the greatest percentage of visitors, 92.2 percent, there on vacation.
The Index has identified expenditure categories that illustrate how people are spending when they visit the Top 20 destination cities:
- Dining consumes the greatest percentage of visitor spend in Istanbul (33.6 percent), & Prague (29.3 percent)
- People spend more on shopping while in Seoul (56.5 percent), London (46.7 percent), Osaka (43.4 percent) & Tokyo (43.1 percent)
- Lodging can be the most expensive part of the trip when visiting Paris (44.8 percent), Milan (40.4 percent) & Rome (40.4 percent)
- With efficient transport systems in place, less budget is spent on transit in London (4.3 percent), Singapore (4.6 percent), & Hong Kong (4.6 percent)